
This is the tell all concerning Es propagation. It is measuring the probability of working Es during the season.
Thanks to the data of John-N5XYO, I was able to fill in several days of the last 2 weeks of August. My return to college kept me off a few days. Probability is based on a single capture in any hour. 1 counts the same as 100. Next week I will show that probability and activity go hand-in-hand.
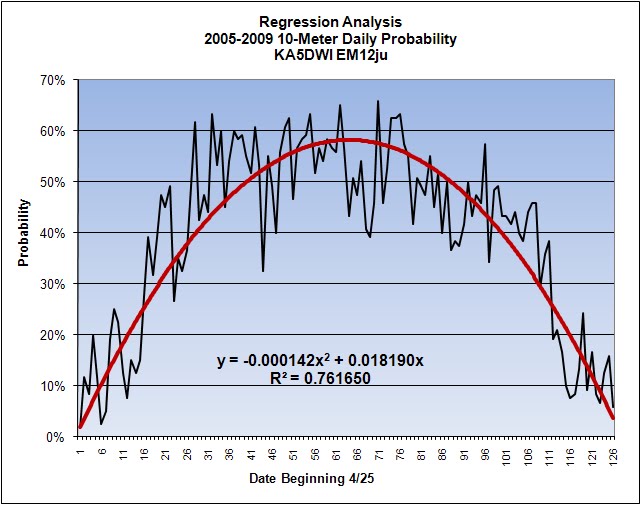
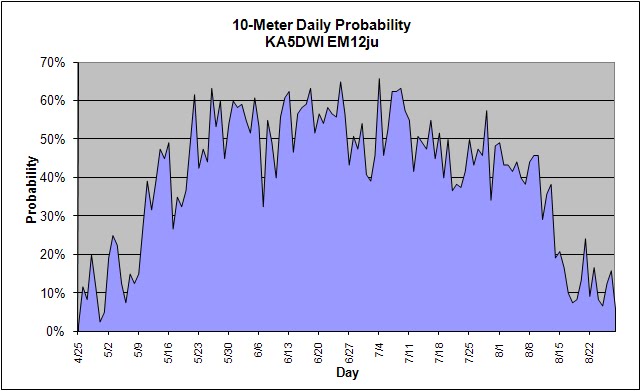
The probability charts clearly show that the season makes short appearances in late April, is in full swing by the 2nd week in May, and stays that way until the 3rd week of August. Probability of a opening peaks around June 27.
The second degree (x squared) regression analysis of the data for probability is as close to perfect as you could ask for.
By May 10 there is 6 hours of Es each day, by May 20 there is 9 hours. On June 3 there is 12 hours per day and is very near a peak of 14 hours per day by June 20. It is at 90% of peak from June 3 until July 17. As in activity charting, the season takes longer to end than it takes to begin. Probability remains good until the start of the 3rd week in August.
Next week I will post a few more detailed charts about Es and then I will begin to detail more specific information on a weekly basis as well as daily information.
73's - Art KA5DWI
No comments:
Post a Comment