A Review of the 2017 Spring/Summer Sporadic Es Season on the 10-Meter Amateur Radio Band
At the end of 2015, I wrote an analysis on the affects of Solar Cycle 24 on the Spring/Summer Sporadic Es season. (http://ka5dwipropagation.blogspot.com/2016/01/how-solar-cycle-24-affected-10-meter.html) The lull between Cycles 23 and 24 was the longest in modern radio history. During those years (2005-2011), Es propagation was exceptional. In particular, there were many multiple-hop Es opportunities and on many occasions good openings would occur late into the night and into twilight.
By 2011, Solar Cycle 24 finally had taken off and it was apparent that it affected Es conditions. By the 2012 season, activity had declined sharply. As solar activity remained active and peaked twice, in continued hold down good Es propagation for several years.
This Solar Cycle (24) has been what I call anemic. It was one of the least active cycles since the early 1900’s and the lowest in radio’s history. It was foretold by Jim Kennedy, K6MIO/KH6 in 2011 at the Central States VHF Society Conference. The magnetic north and south poles of the Sun swap as part of a normal solar cycle. For Cycle 24, these poles were out of sync and to expect a low and poor peak of the Cycle. Jim was right on the money. There was no 2-Meter Aurora in the southern half of the U.S., and I know of no FAI reported on 2-Meters either. 6-Meter F2 was almost non-existent. There was some 6-Meter Trans-Equatorial propagation, but nothing close to what was experienced during Solar Cycle 23.
What was unexpected to me was that Geomagnetic Activity continued to increase after the Cycle peaked. I am not a Physicist, but I believed this increased activity kept putting a lid on a return of Es after the first Solar Activity peak (11/11). After a disappointing 2016, a few out there wondered if Es propagation was a thing of the past. There we some moments during that Spring and Summer that looked promising, but nothing lasted over a period of days.
Over the Fall and Winter of 2016 into 2017, solar activity started to drop like a rock and geomagnetic activity looked to be declining. I anxiously waited for an improvement. Es did not disappoint.

The end of Solar Cycle 23 and the beginning of Cycle 24 occurred in 2008. It took 6 years to peak, normally occurs in 4-5 years. By late 2011, F2 propagation became common place on 10-Meters during the Fall, Winter and early Spring,

Somewhat puzzling was the rise of geomagnetic activity (measured as Ap Index). Confusing was a decline in 2014, but understood as the peak of solar activity (solar flux & sunspot number). It was more active in 2015, peaked and remained active for 2016.
Notes for All PropNET Activity Charts
1. All charts reflect all North American PropNET PSK31 captures on 10-Meters during the recognized Spring/Summer Sporadic Es season (58 days each side of the Summer Solstice). Other continent PropNET captures were removed unless it was an Es capture of/from a North American PropNET participant.
2. All captures considered non-Es (F2, TEP, Ground Wave, or Scatter) were removed from this analysis.
3. Any captures that were not verifiable by a legitimate Callsign or grid-square were also removed.
4. All 10-Meter captures used occurred from UTC dates April 25 through August 15-18, approximately 8 weeks, plus a few days each side of the Summer Solstice (June 20-22).
So what has happened the past nine years to 10-Meter PropNET Es captures?

Hourly Activity Patterns over the Years
Each year is different somewhat, but activity generally shows a dual-peaked diurnal (daytime). The solar and geomagnetic active years (2012-2016) are quite distinguishable.

Regardless of year or solar affects, Es activity soars once the Sun rises and peaks just after mid-morning. Most years, this is the best time for Es. Activity declines as Noon passes, but peaks again a couple of hours before sunset. Once the Sun sets, Es rapidly decline.
Dramatic Rise of 10-Meter Es in One Year – 2016 vs. 2017
The Sunspot Numbers and Solar Flux finally started to decline more rapidly in 2016 and again into 2017. In fact, the rate of decline was much greater than what was experienced between Solar Cycles 23 & 24. Geomagnetic activity was not declining at the same rate. I knew that the year would be better, but I just did not know how good it would improve.

A greater than 2½ increase in activity is something to not recognize. This was greatest change between years since the decline from 2011 & 2012. The rate of growth for PropNET captures was far greater than Non-PropNET, an indication that the lack of conditions the past few years has run off many 10-Meter PSK31 operators.

Due to the lower total count, the number of hours active does not show the dramatic rise in activity. Note that the number of hours active increased from less than one-half of the day to two-thirds. To put it in terms of the Spring/Summer Es season, in 2016 Es were confined to daylight an hour and a half after sunrise and before sunset. In 2017, it extended an hour before sunrise and an hour after sunset.
Intensity per Open Hour
I learned in my past analyses from 2005-2011 that as active hours increased, so did the intensity of that active hour.

There were near 600 more Es active hours in 2017 than 2016, with an average of 49 captures per active hour rather than 19.
Daily Activity
During the lean years and peak of Solar Cycle 24, it was extremely difficult to determine the beginning and end of the Spring/Summer Es season. At the traditional beginning (last week of April) and its end (middle of August), high solar activity had a strong affect. Between, it was difficult to determine the peak of the season (the week of the summer solstice). By 2016, consistency in Es propagation seasonal daily patterns finally began.

By 2016 a more standard pattern of a typical season was evident and a polynomial trend line could be calculated. Despite the return to this pattern, there were a number of days in which little to no propagation occurred.

Note: The scale of this chart is 3 times greater than the 2016 graph.
Despite a slow start, each day of the entire season was greater than the prior.
Despite a slow start, each day of the entire season was greater than the prior.

The polynomial trend line finally followed what had occurred in past good years. This was that the season actually does not end by mid-August. It actually ends at the end of August.
Active Hours for Es Propagation

In 2016, the influence of the Sun was still evident. The season started off well, but failed to be more intense towards the Summer Solstice. The end of the season turned out to be highly productive compared to the traditional peak (solstice).

In 2017, Es became much more productive. There were more numerous 24 hour active days and many over 20 hours. This had not been seen since 2011.
Cumulative 10 Meter Captures
The following charts closely display actually how many 10-Meter captures occurred each day of the season and at what rate.

For 2016, the average number of 10-Meter captures was 213 per day. The period from 6/12 through 6/24 saw higher rates. The remainder tended to fall short.

Hourly Activity and Intensity
The following charts show total hourly activity for the 2016 & 2017 Es season through North America. They are displayed in sunrise, to sunset, to evening, to twilight order to best display the diurnal (daytime) pattern.

Regardless of year or point in the Solar Cycle, the dual-peaked diurnal in prevalent most years.

Note: 2017 scale is 3 times larger than 2016. Each hour of the 2017 season was higher than 2016 and was very similar in pattern.

There were 116 measured days in this analysis. In 2016, most of the daylight hours were open over 50% of the days.

In 2017, most of the daylight hours were open 75% of the days.
Distribution of PropNET Participants
Listed below is 99.5% of the North American 10-Meter PropNET catches.
| Ratio | ||||||
| Rank | Call | Grid Sqr. | Captures | Captured | Total | Capt/Captd |
| 1 | WD4RBX | EM84NN | 18623 | 5113 | 23736 | 3.64 |
| 2 | KE4GWW | EM71HF | 12111 | 10796 | 22907 | 1.12 |
| 3 | VE3GTC | FN25IG | 3185 | 17551 | 20736 | 0.18 |
| 4 | W5LA | EM32VN | 8043 | 11765 | 19808 | 0.68 |
| 5 | W2EV | FN03XD | 6342 | 11959 | 18301 | 0.53 |
| 6 | KF9KV | EN52ET | 6238 | 5956 | 12194 | 1.05 |
| 7 | KD0IOM | EN41EX | 6666 | 3633 | 10299 | 1.83 |
| 8 | KD4IZ | FM19OO | 5355 | 4042 | 9397 | 1.32 |
| 9 | WB8ILI | EN82PQ | 4375 | 4013 | 8388 | 1.09 |
| 10 | KB1JDX | FN41BT | 5401 | 1259 | 6660 | 4.29 |
| 11 | NC5O | EM12PX | 2274 | 4375 | 6649 | 0.52 |
| 12 | KA5DWI | DM34UN | 2683 | 1588 | 4271 | 1.69 |
| 13 | NM4V | FM06QR | 3248 | 56 | 3304 | 58.00 |
| 14 | KI7J | DM42OF | 321 | 1745 | 2066 | 0.18 |
| 15 | KE6AJE | CM98AH | 1227 | 623 | 1850 | 1.97 |
| 16 | AD7LL | EM75ND | 1319 | 492 | 1811 | 2.68 |
| 17 | N6OA | EL99EP | 1122 | 422 | 1544 | 2.66 |
| 18 | ND6M | EM55TC | 342 | 626 | 968 | 0.55 |
| 19 | W6CGH | DM13BR | 271 | 591 | 862 | 0.46 |
| 20 | KF2AT | FN30AS | 81 | 508 | 589 | 0.16 |
| 21 | KC9NBV | EM69OE | 406 | 131 | 537 | 3.10 |
| 22 | K7EK | EM77AT | 238 | 255 | 493 | 0.93 |
| 23 | W7HD | DM42JI | 205 | 103 | 308 | 1.99 |
| 24 | KP3FT | FK68QA | 80 | 127 | 207 | 0.63 |
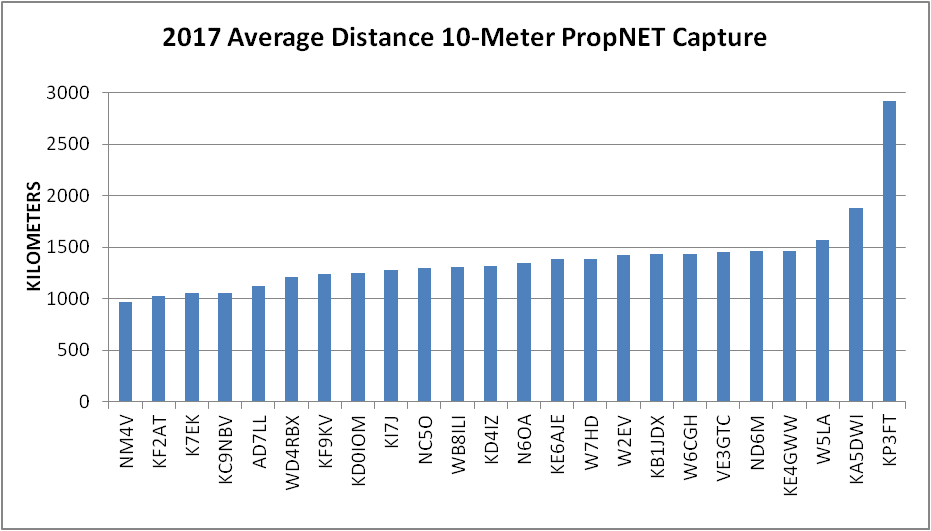
The table shows that many of us out here on the west coast were lonely. Rich, WD4RBX has always been one of the best performers. It is not that the West Coast states have bad propagation; there was not much population of PropNET participants west of the Mississippi River. We really need to improve this next year. I consistently had good 6-Meter propagation to the Central and Southern Plains, as well as the northern Rockies and Northwest. We just had very little and late participation out here on PropNET.
I concentrated on pointing at the PropNET population, and it resulted in me having an average PropNET capture length short of 1,900 kilometers almost 300 more than anyone else on the continent.

Conclusion:
It really was a great year, the best since 2011. There were some bad days and at times elevated solar activity. I would expect another great year next season as solar activity continues to decrease. The recent (September 2017) surge in solar and geomagnetic activity was expected and should be short term. Do not think this recent surge has any real meaning. You might think of this as Cycle 24’s last gasp.
Es are back. I hope you got a chance to play. Thank you East Coast and you out here in the west need to put out a signal next year.
Es are back. I hope you got a chance to play. Thank you East Coast and you out here in the west need to put out a signal next year.
Active Days
The following days for this Spring/Summer Es Season had over 2,000 10M PropNET and Non-PropNET captures for the UTC day.

Note the concentration of signals east of the Mississippi River.
This was very common through the season. I thought this was a bit late in the season for a very active day.
This was very common through the season. I thought this was a bit late in the season for a very active day.

This was the most active of the entire season and I didn’t get to participate that day.

Another day in which the eastern half of the continent had most of the fun.

One of the better days out west. Ou captures require more distance and double-hop.

Later season activity.

Another light day out west.

Generally there is an outstanding day around this date. It was one of my most productive days.
Final Thoughts
Spring/Summer Sporadic Es are back. Had we had a few more stations west of the Mississippi, no telling how active it would have been.
My philosophy and experience is Es beget Es. They show up on 10-Meters for a number of minutes, they appear on 6-Meters. Once strong and intensive on 6, there are good chances on 2-Meters.
I expect a few good years are ahead of us. Don’t miss it!
My philosophy and experience is Es beget Es. They show up on 10-Meters for a number of minutes, they appear on 6-Meters. Once strong and intensive on 6, there are good chances on 2-Meters.
I expect a few good years are ahead of us. Don’t miss it!
Please join us next year. A good time should be had. Expect more Trans-Atlantic and Trans-Pacific.
I enjoy doing this, but only if more of you participate. Lurking is participating too.
Thanks again for reading and I hope it added to your understanding that this band (10-Meters) isn’t dead when the solar cycle drops.
I enjoy doing this, but only if more of you participate. Lurking is participating too.
Thanks again for reading and I hope it added to your understanding that this band (10-Meters) isn’t dead when the solar cycle drops.
73 Art Jackson KA5DWI/7 Arizona
No comments:
Post a Comment